
Responses to COVID-19 with Probabilistic Programming
Assem Zhunis, Tung-Duong Mai, Sundong Kim.
The COVID-19 pandemic left its unique mark on the 21st century as one of the most significant disasters in history, triggering governments all over the world to respond with a wide range of interventions. However, these restrictions come with a substantial price tag. It is crucial for governments to form anti-virus strategies that balance the trade-off between protecting public health and minimizing the economic cost. This work proposes a probabilistic programming method to quantify the efficiency of major non-pharmaceutical interventions. We present a generative simulation model that accounts for the economic and human capital cost of adopting such strategies, and provide an end-to-end pipeline to simulate the virus spread and the incurred loss of various policy combinations. By investigating the national response in 10 countries covering four continents, we found that social distancing coupled with contact tracing is the most successful policy, reducing the virus transmission rate by 96%. We also investigate the recent vaccination efforts and found that widespread vaccination successfully mitigates the virus spread.
Data:
Pipeline:
To quantitatively express and analyze the success and failure of different countries in mitigation of virus spread, we utilize a probabilistic approach to tackle the COVID-19 transmission dynamics. As illustrated in the figure below, our approach has three major components:
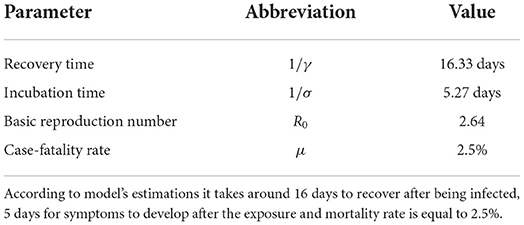
- We infer COVID-19 related parameters such as basic reproduction number R0, incubation rate σ, recovery rate γ, and mortality rate μ using the compartmental model. (Compartmental_model.ipynb)
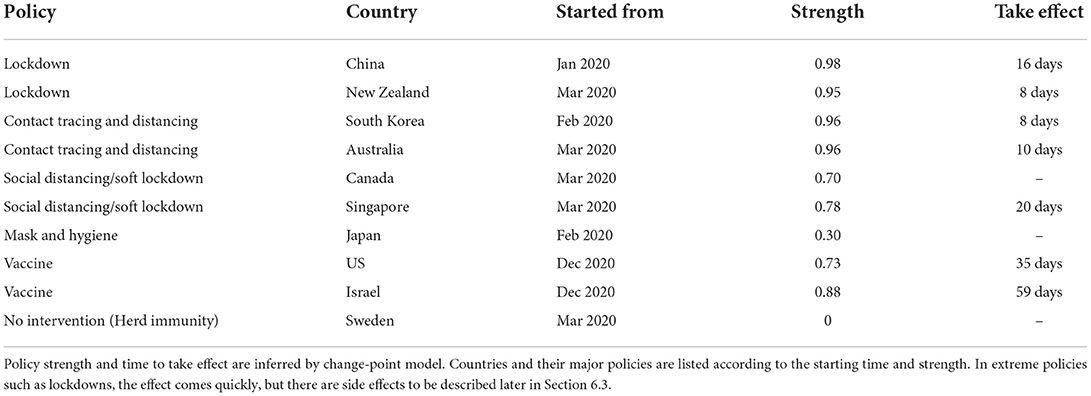
- We apply the change-point model to infer policy efficiencies from different countries. (Changing_point_model.ipynb)
- Finally, using inferred parameters from previous steps and economic parameters from real-world data, we run the generative model in artificial country simulation to estimate the economic cost for different COVID-19 policy combinations. (Policy_cost.ipynb)

NOTE: You can input your own country’s parameters.
Experiments
To see all experiments, please, refer to the Experiments folder on GitHub
If you have problem viewing the file: “Sorry, something went wrong. Reload?”, please follow these links:
Source code:
Experiment files:
- 🇨🇦 Canada
- 🇦🇺 Australia
- 🇨🇳 China
- 🇰🇷 South Korea
- 🇳🇿 New Zealand
- 🇸🇬 Singapore
- 🇺🇸 The US
- 🇮🇱 Israel
- 🇯🇵 Japan
- 🇸🇪 Sweden
Results:
- Estimation results of COVID-19 virus parameters without any interventions.
- Estimated efficacies of policies in 10 countries.
- Estimated cost of various policy combinations.
| Policy combination | Cases | Deaths | Loss (billion $) |
|---|---|---|---|
| MT | T | T | 10734 | 577 | 4.525967 |
| T | T | T | 11003 | 591 | 4.569165 |
| L | L | L | 11003 | 591 | 4.932606 |
| MDLT | MDLT | MDLT | 10006 | 539 | 5.482550 |
| D | D | D | 22478 | 1138 | 8.436941 |
| mt | Lt | Dl | 26023 | 1378 | 10.463221 |
| mt | Lt | Dlt | 25736 | 1370 | 10.472406 |
| mt | L | DlT | 25887 | 1383 | 10.561816 |
| m | L | DT | 59338 | 3502 | 25.313706 |
| M | M | M | 201929 | 8941 | 63.400395 |
| – | m | – | 515900 | 23447 | 165.681432 |
| – | – | d | 453512 | 23862 | 168.641122 |
| – | – | M | 478792 | 24620 | 173.993851 |
| – | – | m | 534917 | 26295 | 185.788009 |
| – | – | – | 592136 | 28018 | 197.926939 |
| – | – | – | 592136 | 28018 | 197.926939 |
Table represents loss regarding applied policies. The most effective policy combination is listed at the top. The meaning of policy notation is as follows:
- None: Doing nothing
- Uppercase: full efficacy
- Lowercase: half efficacy
- L/l: Lockdown
- T/t: Tracing with distancing
- D/d: Distancing
- M/m: Masks and Hygiene
Example: L | l | D denotes the consecutive policy execution of full lockdown (1st month), half lockdown (2nd month) and full distancing (3rd month).
Conclusion
Recent research on COVID-19 propagation analysis has provided a deeper understanding of the transmission processes occurring during the past 1.5 years. Epidemiological models point out the key factors that affect the spread of the virus, including the basic reproduction number, virus incubation period, and daily infection number. In the present study, we have moved one step further to gauge the efficacy of the early-stage policy to respond to the pandemic, with economic factors related to the policy itself and its benefits of slowing down the virus. Detailed analysis from 10 countries suggests that social distancing, coupled with contact tracing, is the most efficient policy among major initial interventions. From the data of Asian countries, we derive meaningful results that close contact tracing could provide protection to citizens from the pandemic comparable to lockdowns, without inducing as much cost. Going one step further, we carefully designed a simulated country and gauged the efficacy of each policy combination. Our testbed allows end-users to control various parameters suitable for their country’s situation. Through the process of overcoming COVID-19, we are gaining a clearer understanding of the trade-off between virus prevention and economic loss. As we have seen in many countries, it is crucial to identify each policy’s efficiencies and costs and to estimate the best time and intensity to impose them before it is too late. We hope that our research will assist every nation in responding to possible future pandemics.
For more details, please check our GitHub repository:
https://github.com/assemzh/ProbProg-COVID-19
Code references:
We adapt some of our code from these sources:
Citation
If you find this code useful, please cite the original paper:
@article{zhunis2022responses,
  title={Responses to COVID-19 with probabilistic programming},
  author={Assem Zhunis and Tung-Duong Mai and Sundong Kim},
  journal = {Frontiers in Public Health},
  year = {2022}
}